Hypothesis Testing (in a nutshell)

alpha is 1 - confidence interval. So if we want to be 99% sure our findings are not explained by randomness, then our alpha would be 0.01p value.from scipy import statsp value.p < alpha then we reject the null hypothesis. Otherwise we fail to reject the null hypothesis, which means "We failed to prove the effect/relationship" in English.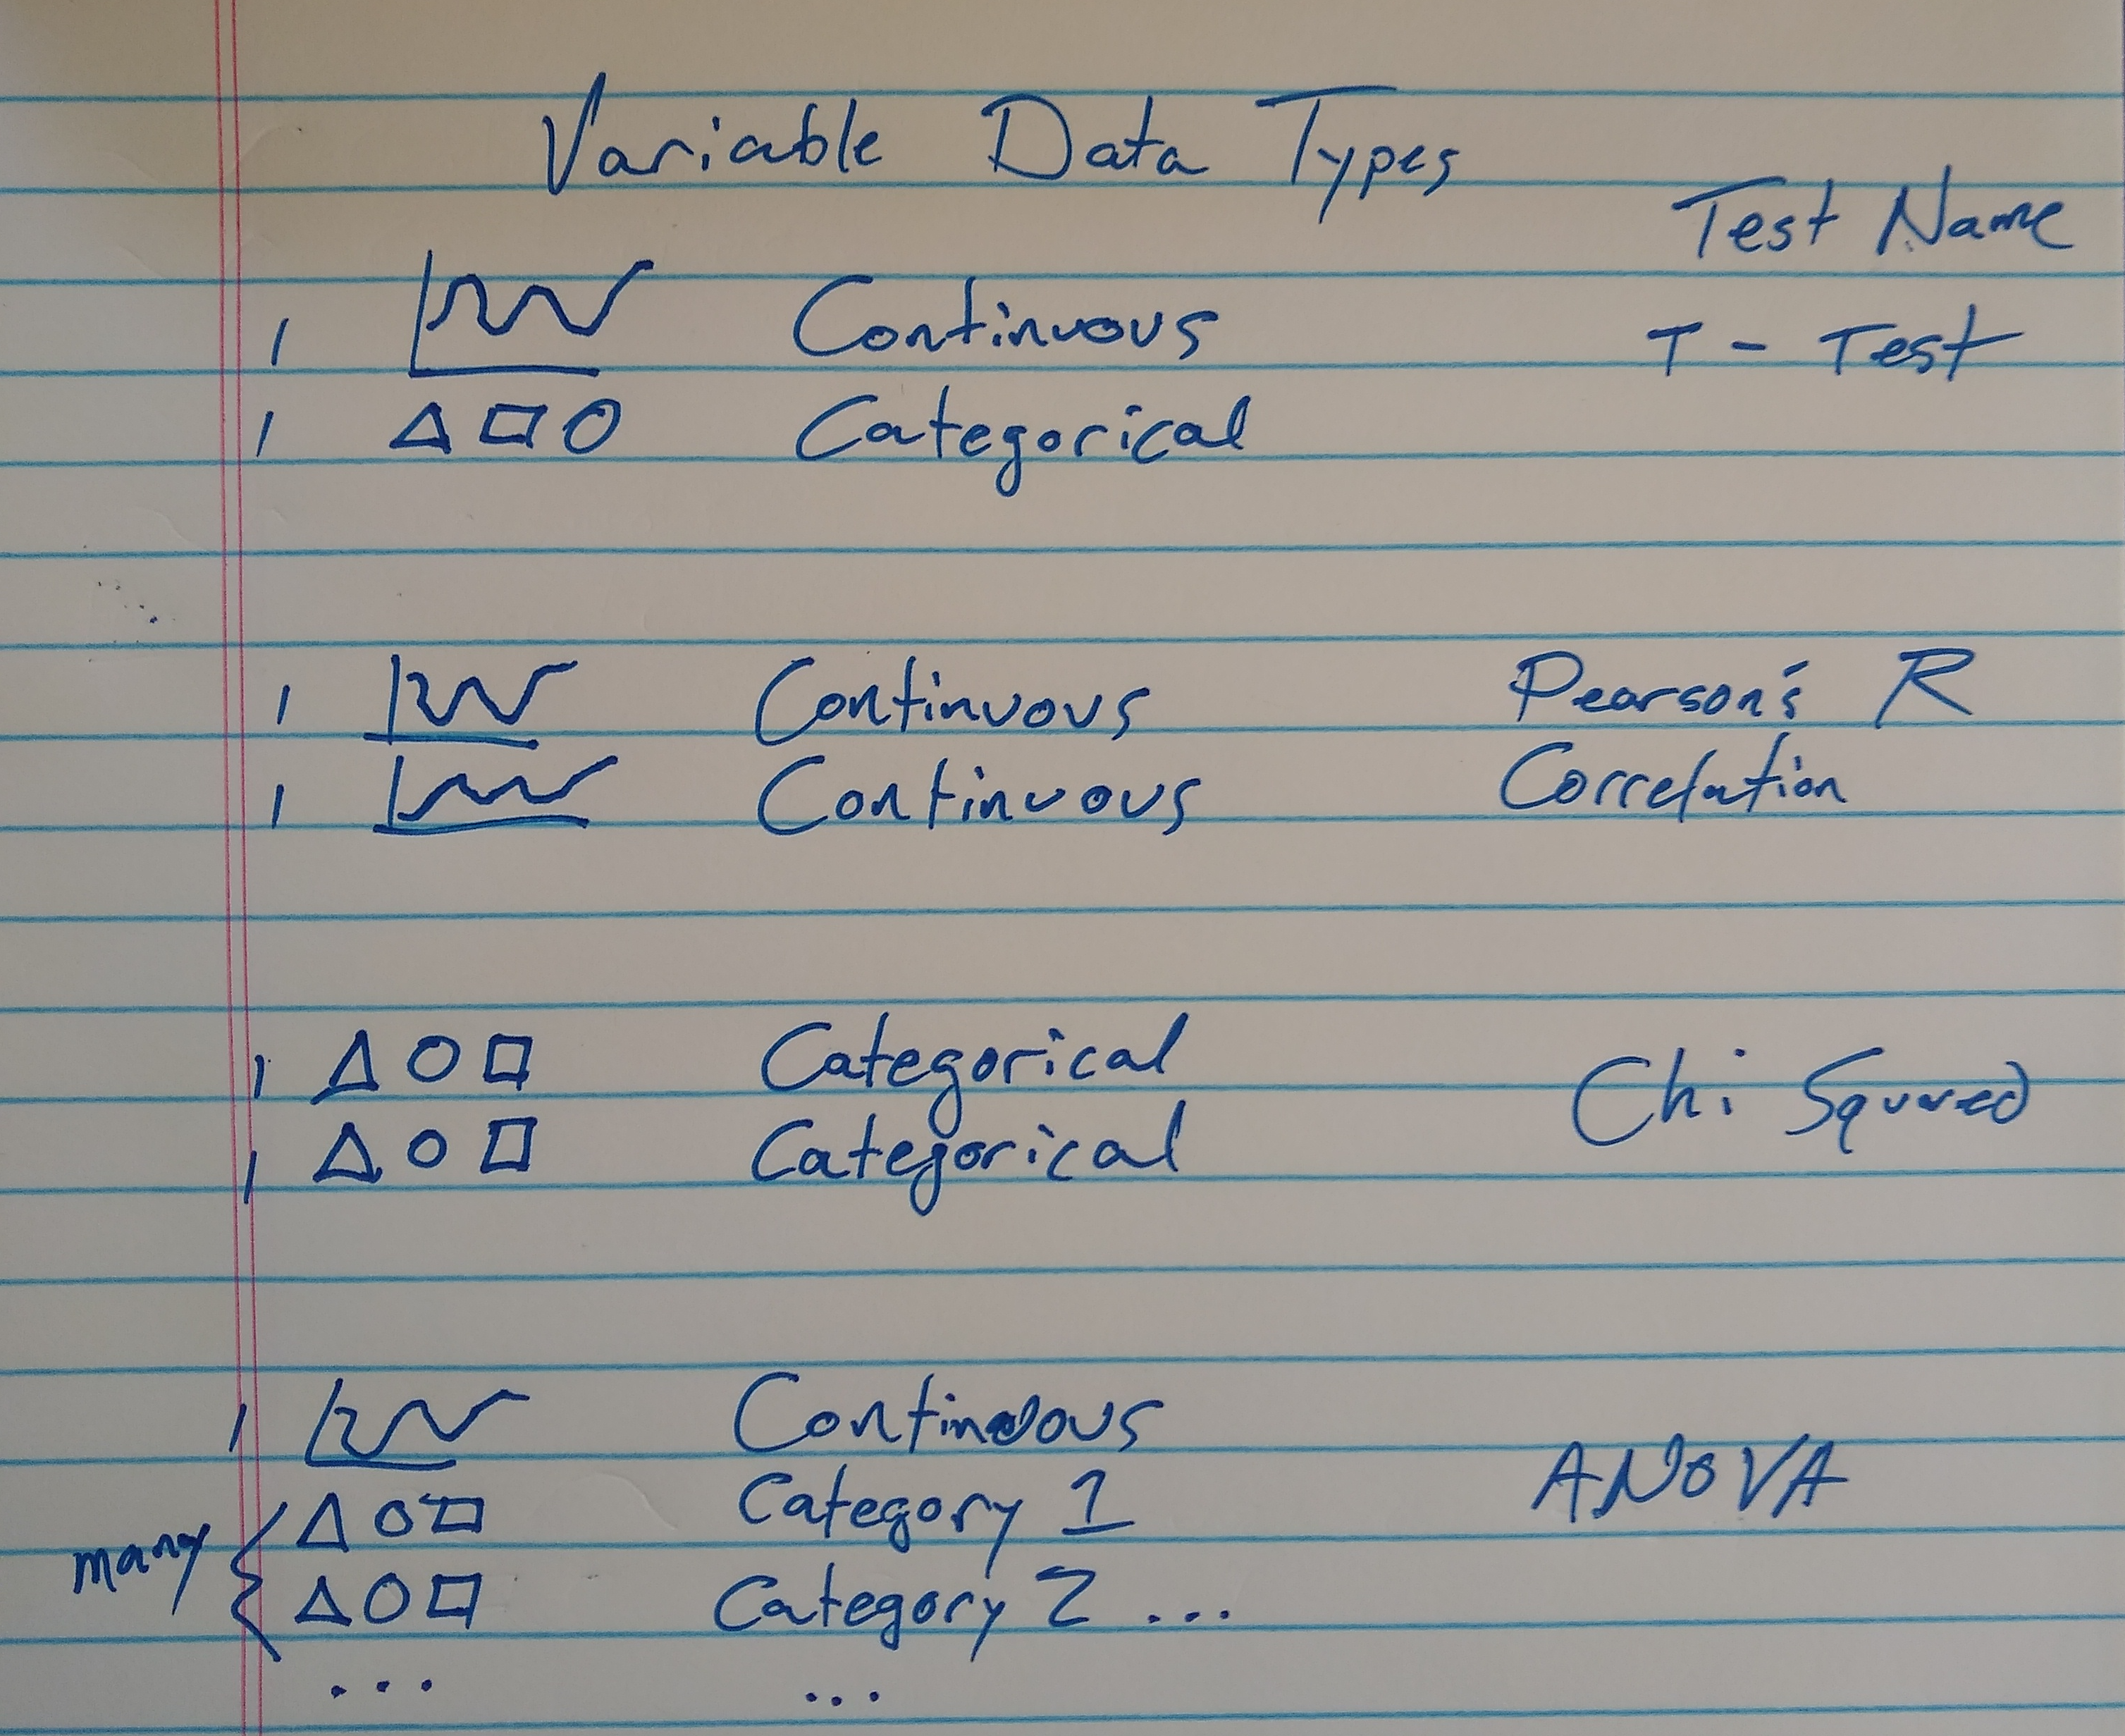
from pydataset import data
import pandas as pd
import numpy as np
import matplotlib.pyplot as plt
import seaborn as sns
df = data("tips")
df.head()
| total_bill | tip | sex | smoker | day | time | size | |
|---|---|---|---|---|---|---|---|
| 1 | 16.99 | 1.01 | Female | No | Sun | Dinner | 2 |
| 2 | 10.34 | 1.66 | Male | No | Sun | Dinner | 3 |
| 3 | 21.01 | 3.50 | Male | No | Sun | Dinner | 3 |
| 4 | 23.68 | 3.31 | Male | No | Sun | Dinner | 2 |
| 5 | 24.59 | 3.61 | Female | No | Sun | Dinner | 4 |
Hypothesis testing allows us to answer business questions with statistical tests.
null_hypothesis = "Total Bill and Tip amount do not have a linear relationship"
alternative_hypothesis = "Total bill and tip have a linear relationship"

# We want to be 99% sure that our findings are not due to randomness/chance
confidence_interval = 0.99

# We need to define our alpha before we run any tests
alpha = 1 - confidence_interval
from scipy import stats

corr, p = stats.pearsonr(df.total_bill, df.tip)
corr, p
(0.6757341092113647, 6.6924706468630016e-34)
# If our p is lower than our alpha, then we reject the null
if p < alpha:
    print("We reject the null hypothesis that", null_hypothesis)
    print("We move forward with the understanding that", alternative_hypothesis)
else:
    print("We fail to reject the null hypothesis")
    print("we are unable (currently) to prove there's no linear relationship")
We reject the null hypothesis that Total Bill and Tip amount do not have a linear relationship
We move forward with the understanding that Total bill and tip have a linear relationship
plt.title("Total Bill vsb Tip amount")
sns.regplot(x="total_bill", y="tip", data=df)
plt.show()

 There are 2 approaches to T-Tests
# We want to be sure that the effect we see isn't explained by chance, so we'll keep our alpha super low
null_hypothesis = "Friday tips are the same as the rest of the week."
alternative_hypothesis = "Friday tips are different than the rest of the week"
alpha = 0.01
# We'll isolate our one subgroup to compare its mean vs. the population
sunday = df[df.day == "Fri"]
t, p = stats.ttest_1samp(sunday.tip, df.tip.mean())
print(f't = {t:.3f}')
print(f'p = {p:.3f}')
t = -1.127
p = 0.275
if p < alpha:
    print("We reject the null hypothesis that", null_hypothesis)
    print("We move forward with the alternative hypothesis that", alternative_hypothesis)
else:
    print("We fail to reject the null")
    print("Our evidence does not support the claim that Friday tips are different than the rest of the week")
We fail to reject the null
Our evidence does not support the claim that Friday tips are different than the rest of the week
null_hypothesis = "Smoking tables and non-smoking tables tip the same amount"
alternative_hypothesis = "Smoking tables and non-smoking tables tip a different amount"
alpha = 0.01 # we want to be 99% sure our results aren't the result of chance/randomness
smoking = df[df.smoker == "Yes"]
non_smoking = df[df.smoker == "No"]

t, p = stats.ttest_ind(smoking.tip, non_smoking.tip)
p
0.9265931522244976
if p < alpha:
    print("We reject the null hypothesis that", null_hypothesis)
    print("We move forward with the hypothesis that", alternative_hypothesis)
else:
    print("We fail to reject the null hypothesis")
    print("Evidence does not support the claim that smoking vs. non-smoking talbes tip differently")
We fail to reject the null hypothesis
Evidence does not support the claim that smoking vs. non-smoking talbes tip differently
import seaborn as sns
plt.title("Total Bill vs. Tip by smoking status")
sns.scatterplot(x="total_bill", y="tip", data=df, hue="smoker")
plt.show()

null_hypothesis = "There is no dependence between smoking status and time of day (Lunch or Dinner)"
alternative_hypothesis = "There is a dependence between time of day (lunch/dinner) and smoking status"
alpha = 0.01 # we want to be 99% sure that the evidence we see is not due to chance
observed = pd.crosstab(df.time, df.smoker)
chi2, p, degf, expected = stats.chi2_contingency(observed)
p
0.4771485672079724
if p < alpha:
    print("We reject the null that", null_hypothesis)
    print("We move forward with the alternative hypothesis that", alternative_hypothesis)
else:
    print("We fail to reject the null")
    print("Evidence does not support the claim that smoking status and time of day are dependent/related")
We fail to reject the null
Evidence does not support the claim that smoking status and time of day are dependent/related
sns.catplot(x="time", hue="smoker", kind="count", data=df)
<seaborn.axisgrid.FacetGrid at 0x117edbcf8>

print(df[df.time == "Dinner"].smoker.value_counts())
print("The ratio of smokers to non-smokers at Dinner is", 70/176)
No     106
Yes     70
Name: smoker, dtype: int64
The ratio of smokers to non-smokers at Dinner is 0.3977272727272727
print(df[df.time == "Lunch"].smoker.value_counts()) # so 23 / (23 + 45)
print("The ratio of smokers to non-smokers at Dinner is", 23 / (23 + 45))
No     45
Yes    23
Name: smoker, dtype: int64
The ratio of smokers to non-smokers at Dinner is 0.3382352941176471
# Let's check if smoking status is independent of which day of the week
null_hypothesis = "Smoking status and day of the week are independent. There's no dependence/relationship"
alternative_hypothesis = "Smoking status and day of the week are dependent"
observed = pd.crosstab(df.day, df.smoker)
chi2, p, degf, expected = stats.chi2_contingency(observed)
p
1.0567572499836523e-05
if p < alpha:
    print("We reject the null that", null_hypothesis)
    print("We move forward with the alternative hypothesis that", alternative_hypothesis)
else:
    print("We fail to reject the null")
    print("Evidence does not support the claim that smoking status and the day of week are dependent/related")
We reject the null that Smoking status and day of the week are independent. There's no dependence/relationship
We move forward with the alternative hypothesis that Smoking status and day of the week are dependent
sns.catplot(x="day", hue="smoker", kind="count", data=df)
<seaborn.axisgrid.FacetGrid at 0x11808aa58>

total_bill null_hypothesis = "Average Tip amounts are the same across days of the week"
alternative_hypothesis = "Average tips are different on different days of the week"
alpha = 0.01 # Let's be 99% certain the result we see isn't due to chance/randomness
# Let's isolate out the tips by day
thursday_tips = df[df.day == "Thur"].tip
friday_tips = df[df.day == "Fri"].tip
saturday_tips = df[df.day == "Sat"].tip
sunday_tips = df[df.day == "Sun"].tip
# f_oneway is our ANOVA test
# See https://docs.scipy.org/doc/scipy/reference/generated/scipy.stats.f_oneway.html for more info
from scipy.stats import f_oneway

f, p = f_oneway(thursday_tips, friday_tips, saturday_tips, sunday_tips)
p
0.1735885553040592
if p < alpha:
    print("We reject the null hypothesis that", null_hypothesis)
    print("We move forward with the alternative hypothesis that", alternative_hypothesis)
else:
    print("We fail to reject the null hypothesis")
    print("Evidence does not support the claim that tip averages are significantly different across days of the week.")
We fail to reject the null hypothesis
Evidence does not support the claim that tip averages are significantly different across days of the week.
sns.catplot(x="day", y="tip", kind="bar", data=df)
<seaborn.axisgrid.FacetGrid at 0x1182d9ef0>

The $H_0$ null hypothesis is always framed as:
If the $p$ is low, reject the null